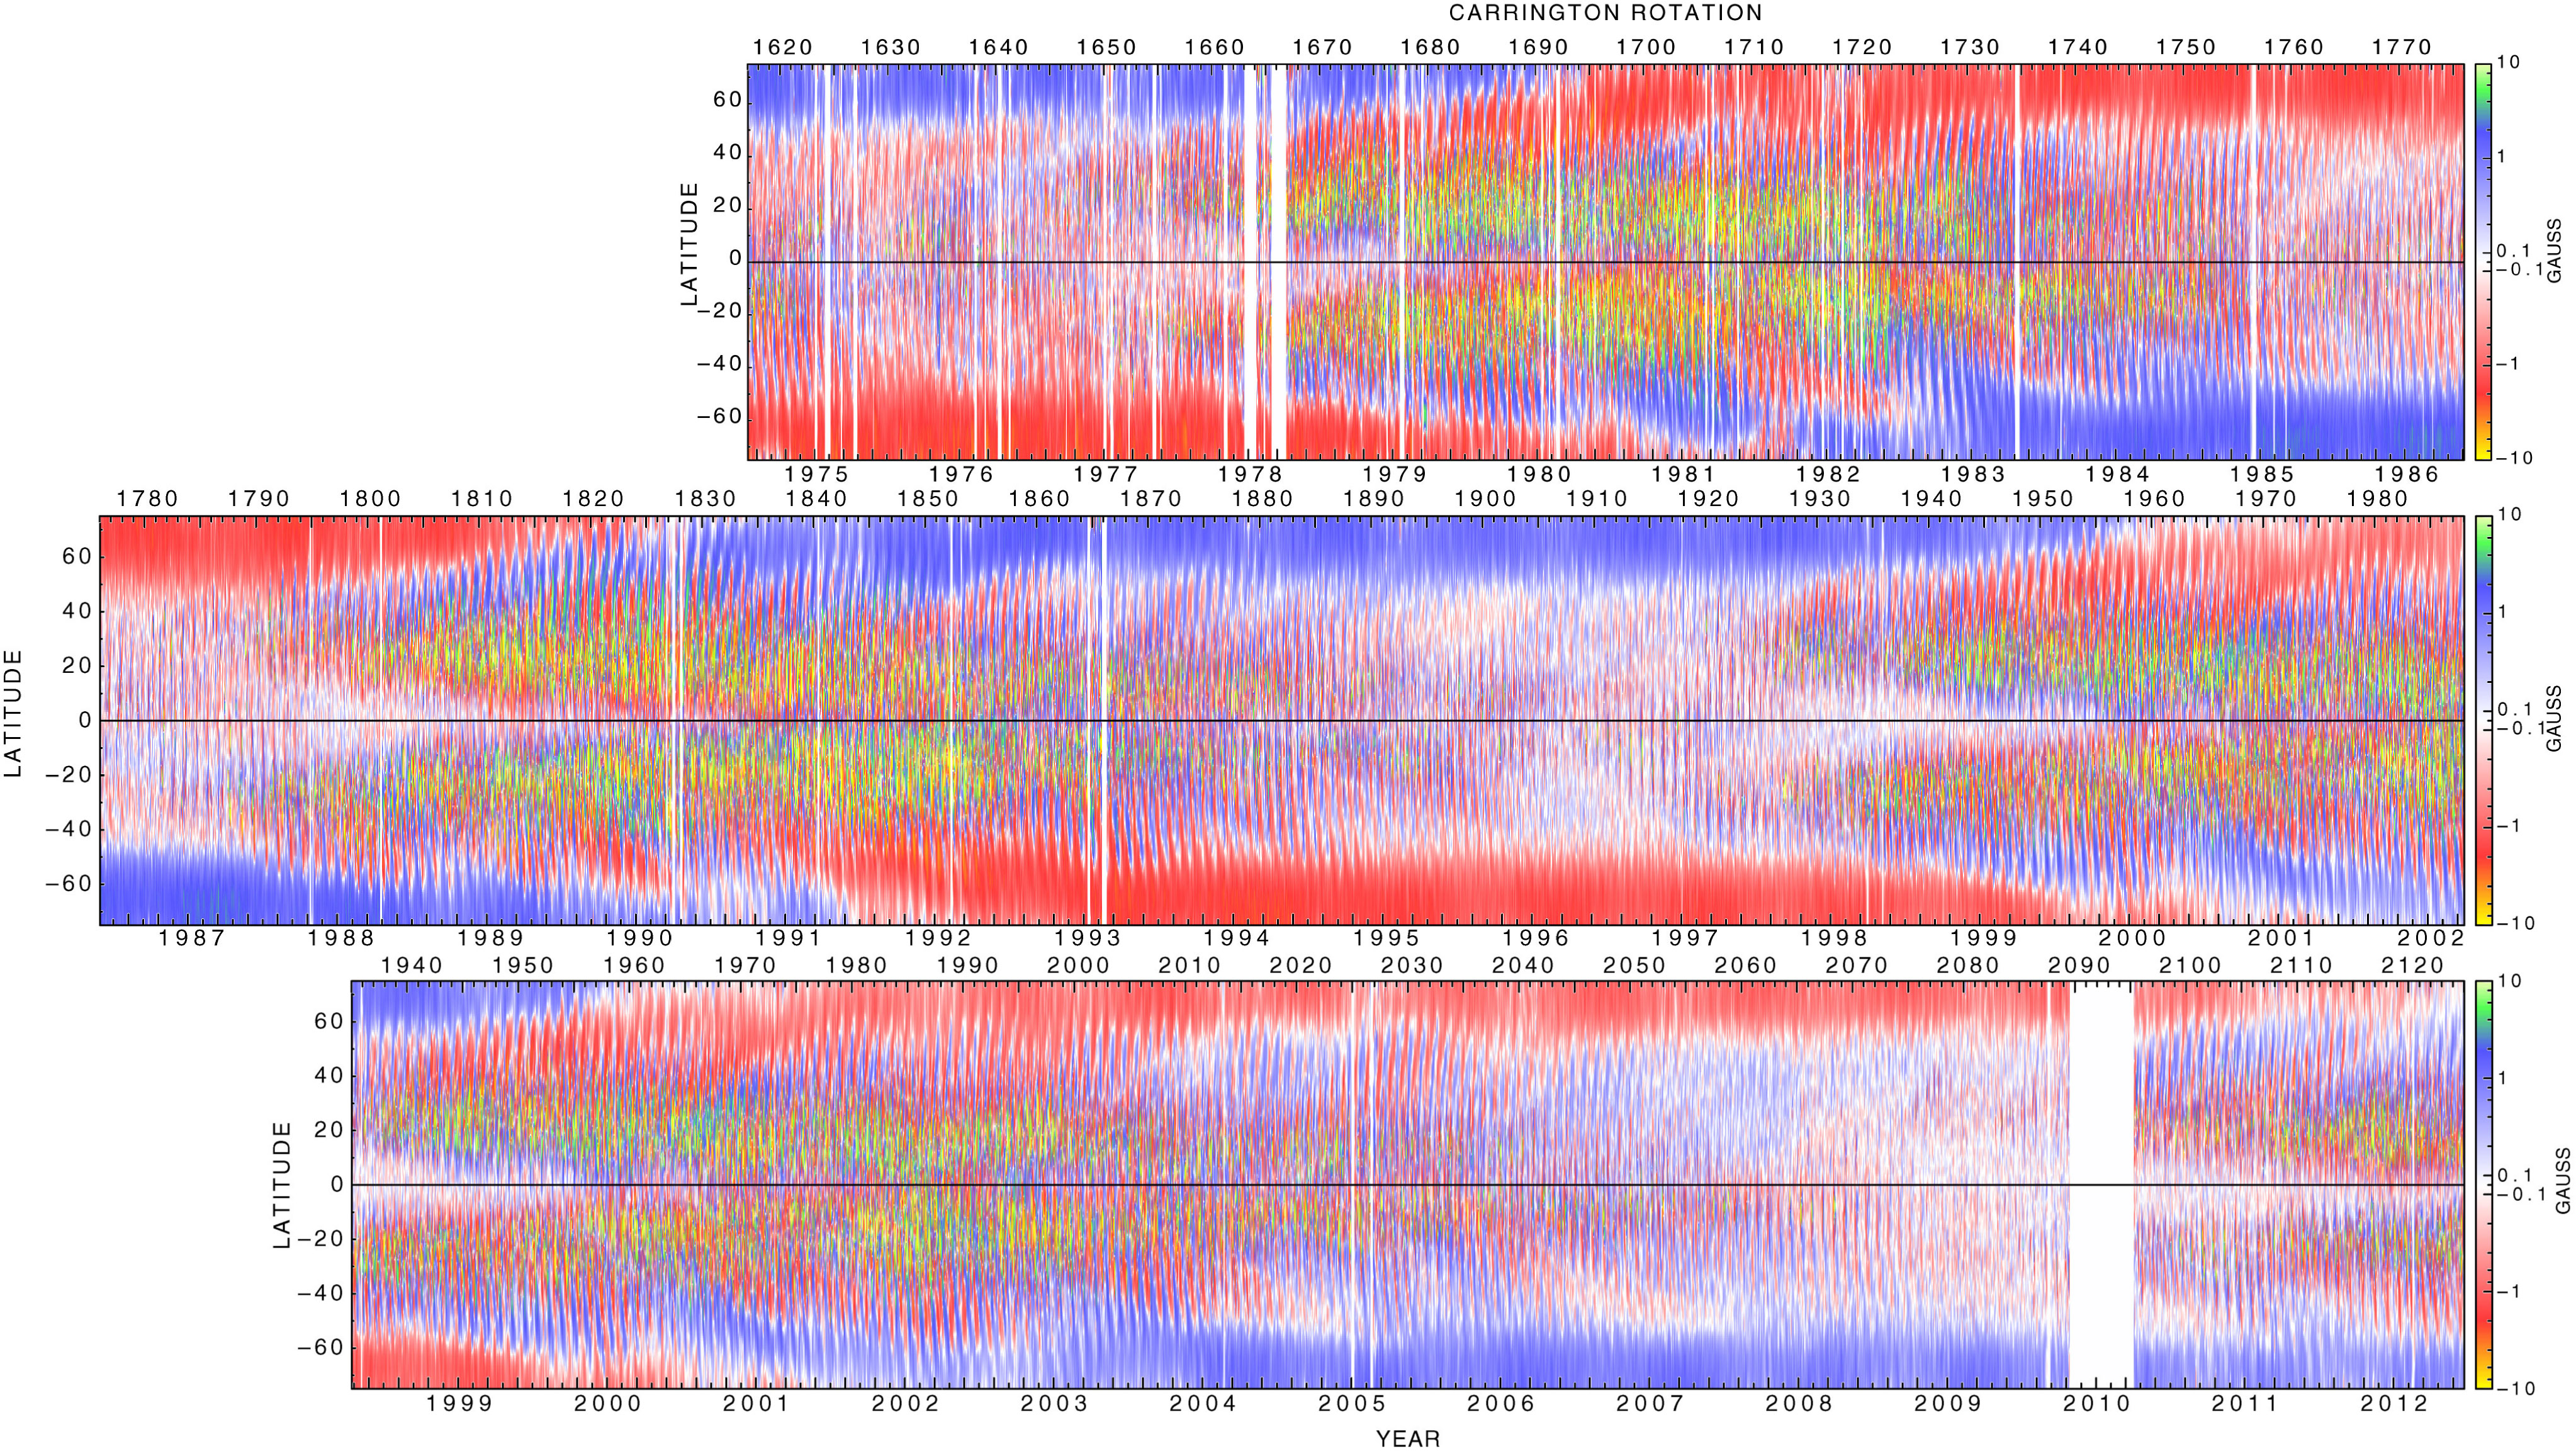
 HE above plots show long-term changes in the sun's surface magnetic and velocity field structure. (Click on either image for a larger 470 Kb. version.) These supersynoptic charts are created using daily observational data from the 150-foot solar telescope. As the sun rotates, each portion of the sun's surface is carried past our line of sight and is generally visible for a period of about 12 days (we can see the photosphere a bit longer at the solar limbs, but with such an oblique angle little information is recovered). The solar rotation is used to determine the direction of motion for the velocity plots and an average angle of tilt for the magnetic field plots. HE above plots show long-term changes in the sun's surface magnetic and velocity field structure. (Click on either image for a larger 470 Kb. version.) These supersynoptic charts are created using daily observational data from the 150-foot solar telescope. As the sun rotates, each portion of the sun's surface is carried past our line of sight and is generally visible for a period of about 12 days (we can see the photosphere a bit longer at the solar limbs, but with such an oblique angle little information is recovered). The solar rotation is used to determine the direction of motion for the velocity plots and an average angle of tilt for the magnetic field plots.
Although the above figures are very compressed in time, each rotation is divided up into nine separate sections and plotted as a vertical strip. A horizontal line placed on either diagram gives a time history of the solar surface at a fixed latitude as the plasma on the solar surface crosses the central meridian (the imaginary line of the north-south rotational axis passing through the center of the sun's apparent disk).
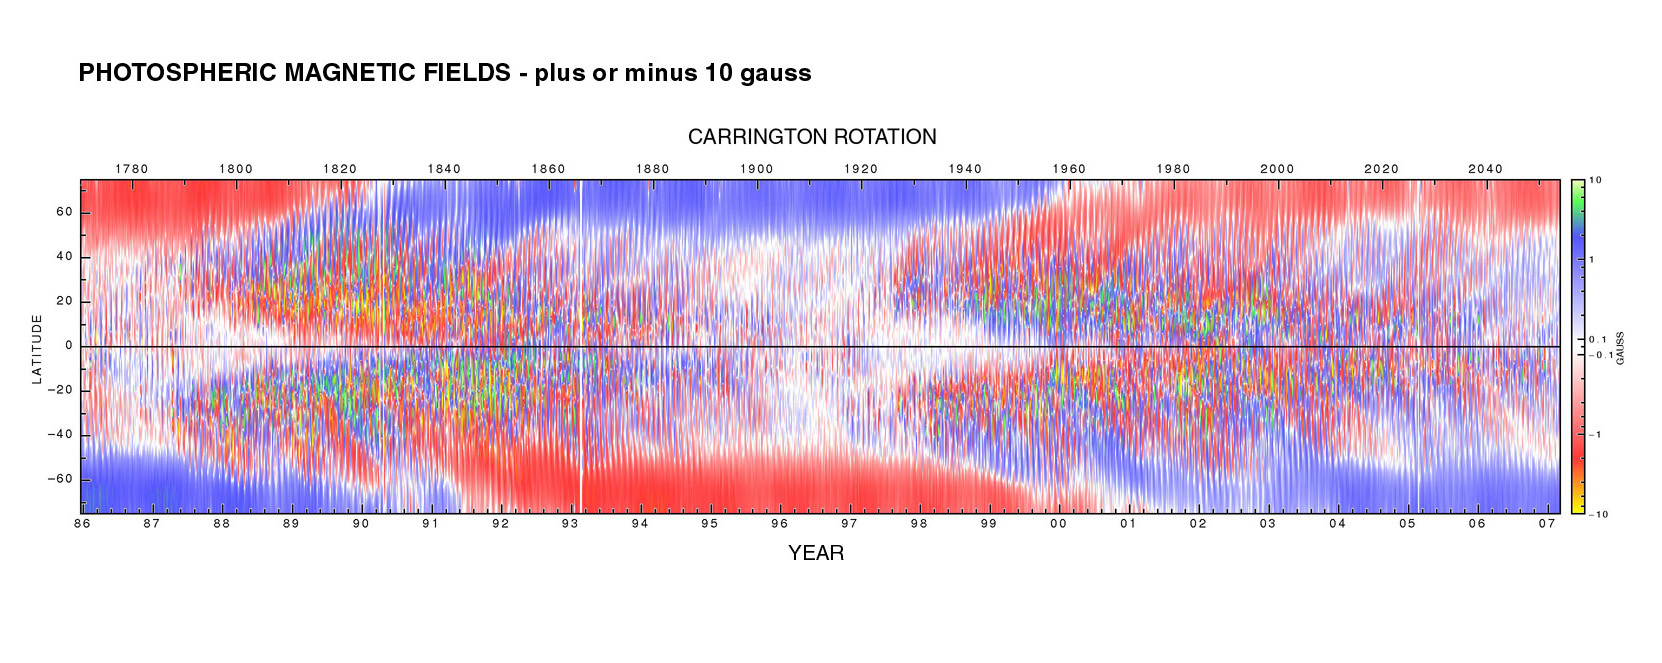
In the upper chart you can see long-term changes in the sun's longitudinal magnetic fields. Red on the plot represents a minus or "South" field, and blue represents a plus or "North" field. Most obvious are the areas of strong solar activity which tend to start at high latitudes at the beginning of each solar cycle, then migrate down towards the solar equator. These areas of magnetic activity are where sunspots form during the period surrounding solar maximum. Notice too that in between these activity cycles the sun's surface has very little magnetic activity. This is solar minimum, and it can be seen on this plot as the time periods centered about late 1986 and mid 1996.
Also shown in the upper chart is the reversal of the sun's general (polar) magnetic field which takes about 22 years for a complete cycle. Notice that during the period from 1986 to mid-1990, the sun's north polar region was of a negative polarity. Then for a period of about a year it was in the
process of reversal. Following this, from 1991 to about 2000, the north pole was of the opposite positive polarity. In 2001 the sun's poles reversed again, as seen by the white (neutral) areas at both the north and south poles. The fact that the sun has a fundamental 22-year magnetic cycle was discovered using 150-foot solar tower data by Carnegie astronomers George E. Hale and Seth B. Nicholson in 1925, and that the polar fields are also cyclic in nature was discovered by Carnegie astronomers Harold D. Babcock and Horace W. Babcock in 1952.
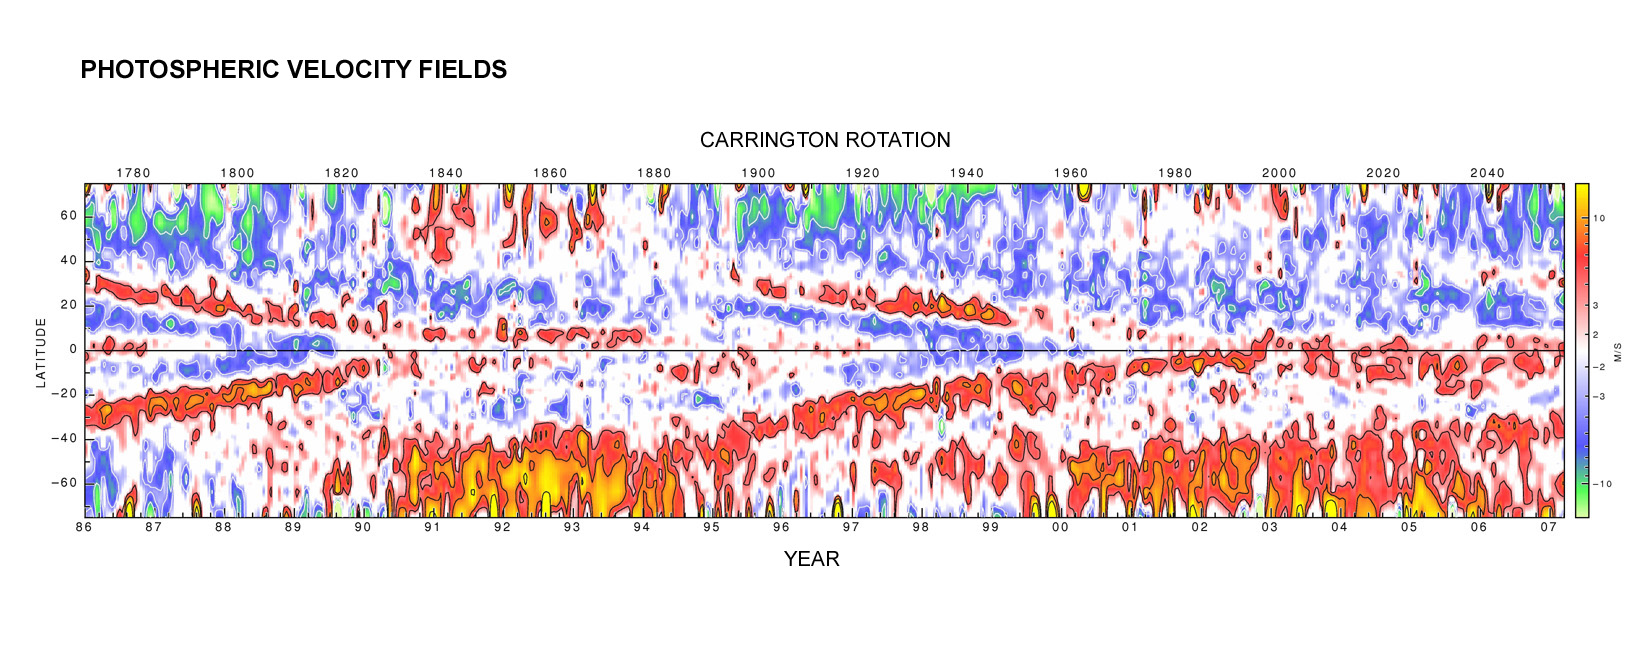
In the lower chart, you can see superimposed on the random convective motions of the solar atmosphere long-lived waves of slightly higher east-west velocity (from subtracted background rotation) which move down from high latitudes to the equator with a period of about 11 years. On this plot, these waves are seen most clearly as the red colored V patterns pointing to the right. These Torsional Oscillations were discovered by Carnegie astronomers Robert F. Howard and Barry J. LaBonte using 150-Foot solar telescope data in 1980. A recent detailed description of these long-lived velocity patterns can be found in the paper by Dr. Roger Ulrich below.
| 
![[*]](images/ballYell.gif)