|
The 150-Foot Solar Tower
Current Selected Data |
The following is a selection of data and graphs that may be of interest
to the scientific community and general public. The raw MPSI data (and associated graphs) provide an excellent indication of the general level of integrated solar activity.
MPSI and MWSI Data
For each magnetogram taken at the 150-Foot Solar Tower, a Magnetic Plage Strength
Index (MPSI) value and a Mt. Wilson Sunspot Index (MWSI) value are calculated.
To determine MPSI we sum the absolute values of the magnetic field strengths for
all pixels where the absolute value of the magnetic field strength is between
10 and 100 gauss. This number is then divided by the total of number of pixels
(regardless of magnetic field strength) in the magnetogram. The MWSI values are
determined in much the same manner as the MPSI, though summation is only done
for pixels where the absolute value of the magnetic field strength is greater
than 100 gauss. A text file containing the average MPSI and MWSI values for every
day such values were determined (since 1970) is available here: index.dat.
A line of data is added to the text file for every day observations are made.
The first value in each line is the average date in an abbreviated julian date
format (signified by the letter "j" prior to the value). The abbreviated format
is the julian date - 2440000.0. Thus:
May 23, 1968 at noon U.T. = julian day 2440000.0 = j0.0
The second value in each line is the average MPSI value corresponding to the abbreviated
julian date as described above. The third value in each line is the average MWSI
value.
![[*]](images/ballYell.gif) Please read our data release statement.
Please read our data release statement.
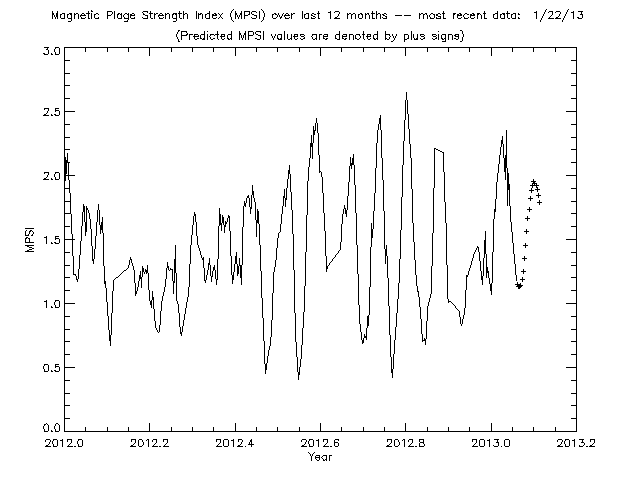
Data from the most recently reduced observation(s)
For 5 observations taken on 01-22-13:
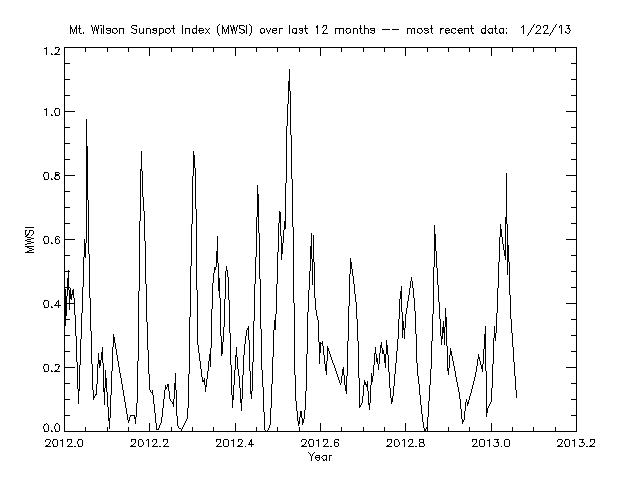
Average MPSI = 1.1770; Average MWSI = 0.1048
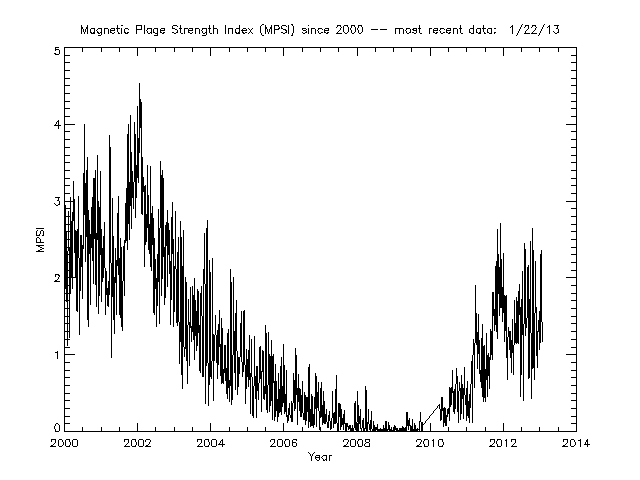
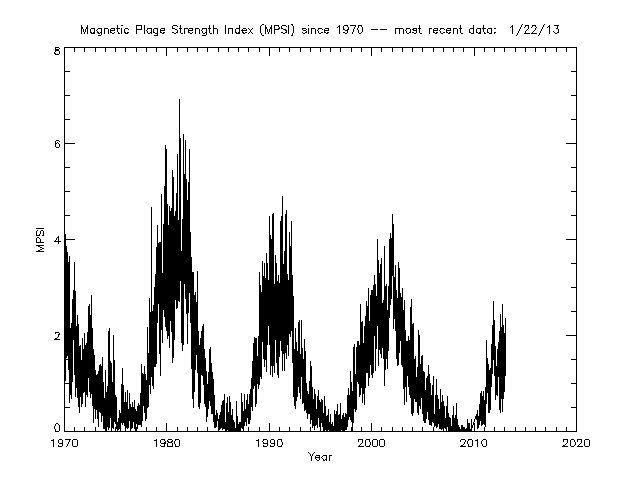
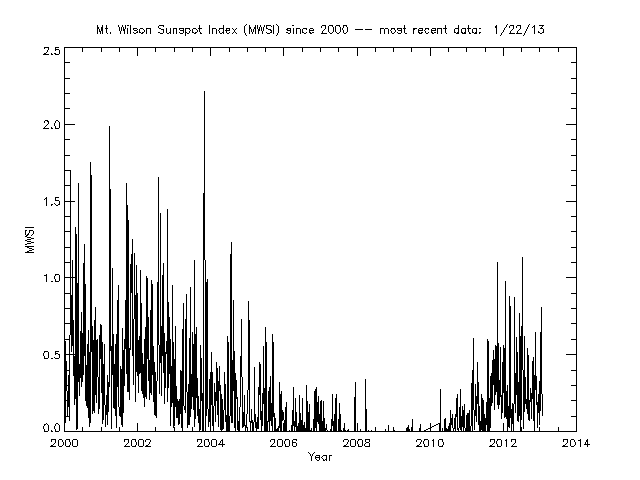
Magnetic Plage Strength Index Plots:
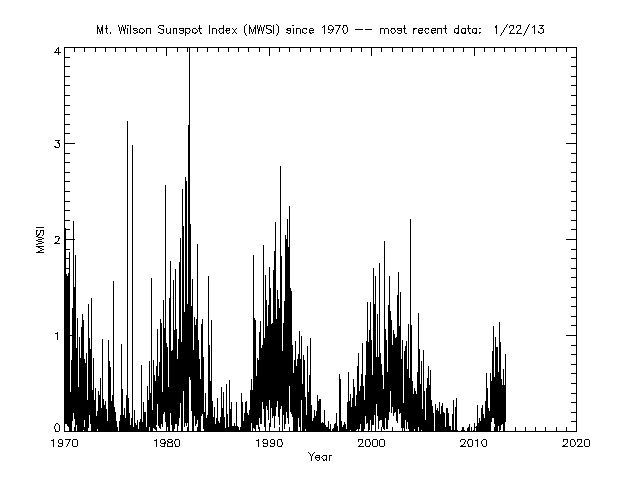
Mt. Wilson Sunspot Index Plots:
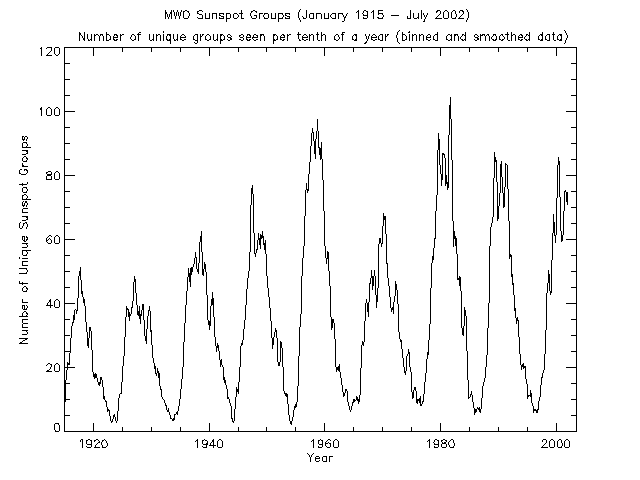
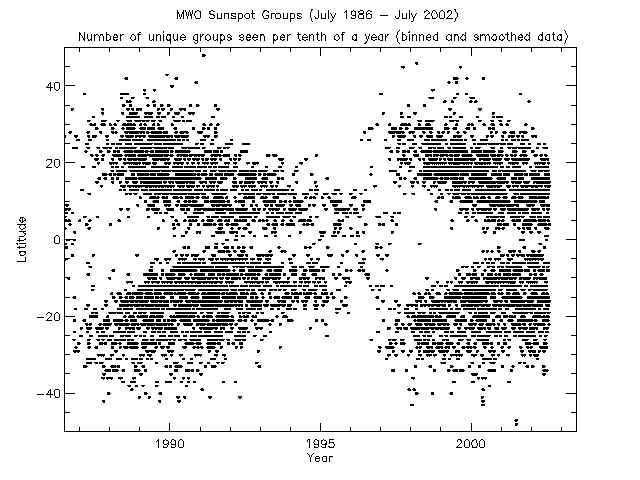
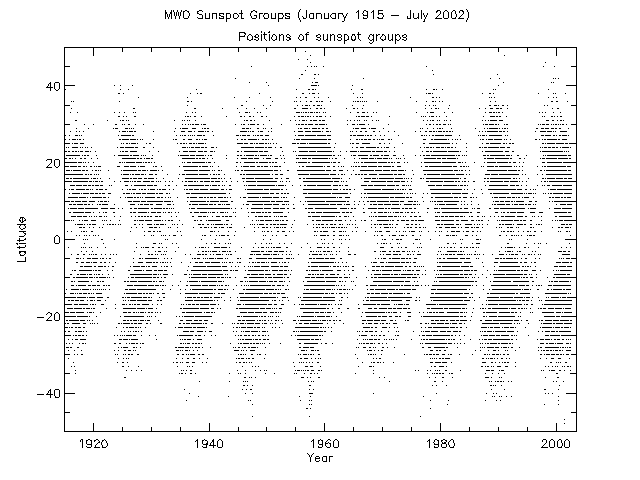
Sunspot Group Data
A drawing of sunspots, their locations and magnetic field strengths is created
every clear day at the Mt. Wilson Observatory 150-Foot Solar Tower. For a complete
description of this process, please refer to the 150-Foot
Solar Tower Sunspot Drawing Page. At the end of each month, a sunspot report detailing the previous month's sunspot
activity is created. This data is available at the Monthly
Sunspot Report Page. The plots below were created with the above described data.
Mt. Wilson Sunspot Group Plots:
Page content and all images © 2003 The Regents
of the University of California. All rights reserved.